Response-tools Examples 🦊
This module contains functions to handle the visualization of the various response data products.
Data handling examples
Functions & Outputs
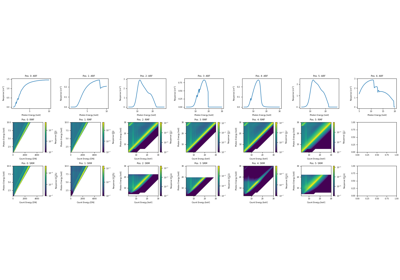
File:
plot_functions_and_outputs.py.Shows how to use the functions and their outputs in the package.
Create an ARF from scratch
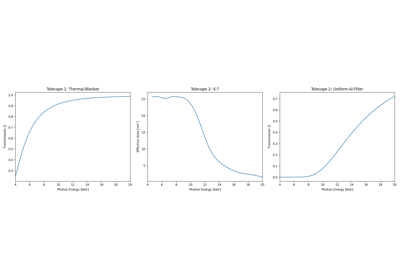
File:
plot_arf_from_scratch.py.Shows how to compile a telescope ARF from individual components.
Example FOXSI-4 RMFs
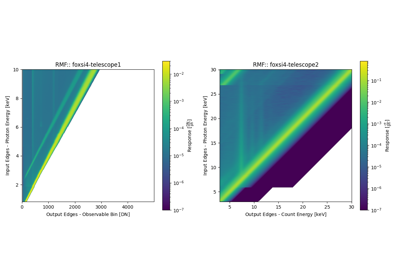
File:
plot_rmf_examples.py.Shows how to obtain and work with a detector’s RMF data-class.
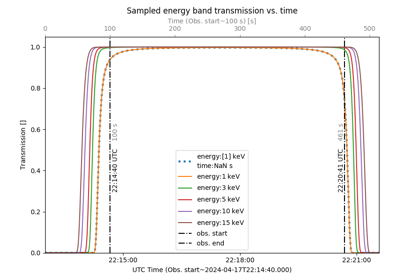
Time ranges and the atmospheric response
File:
plot_atmospheric_response.py.Shows how to choose a time range in the code for atmospheric transmissions.
Plotting examples
Generating and plotting ARFs, RMFs, and SRMs
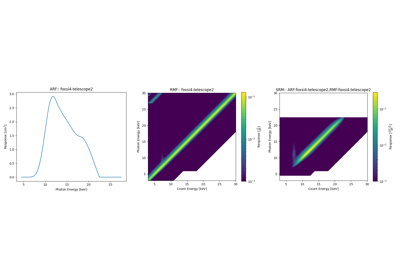
File:
plot_arf_rmf_srm.py.Shows how to obtain and plot the ARF, RMF, and SRM for Telescope 2.
Telescope ARFs, RMFs, and SRMs
File:
plot_telescope_arfs_rmfs_srms.py.Shows a test
assetfunction to produce a response plot for all of FOXSI-4’s telescopes.